USD Breakout Strategy
The USD Breakout strategy took its name after the time zone in which it is traded, which is the open of the US markets (i.e. the New York time zone). Some people also call it the Big Dogs 1400-1600 strategy, because it is believed that the institutional players are the ones who push the market between the hours of 1400hrs and 1600hrs UTC +1, which is when the US markets have an overlap with the London session, creating probably the greatest period of volatility seen of the three forex trading overlap zones. This system has the potential to pull in daily profits of 50 pips.
Best Forex Brokers UK
-
Pepperstone offers ultra-competitive forex spreads averaging 0.12 pips on EUR/USD in the Razor account, accompanied by a diverse portfolio comprising 100+ currency pairs - an extensive selection surpassing most competitors. Additionally, Pepperstone distinguishes itself by offering three currency indices (USDX, EURX, JPYX), not commonly found among alternative platforms. Pepperstone has now won our annual 'Best Forex Broker' award twice.
-
XTB provides access to 70+ currency pairs with low spreads averaging around 1 pip on majors. The xStation platform offers an intuitive environment for forex traders with an excellent charting package encompassing 30+ indicators, plus a range of order types, catering to various strategies and risk management techniques.
-
FXCC's key selling point is its forex trading conditions. ECN spreads come in as low as 0.0 pips during peak trading hours, while it supports a wider range of currency pairs than the majority of rivals with over 70 forex assets. Additionally, you have access to MT4, which was built specifically for forex trading and excels for its charting tools.
Indicators
This strategy makes use of a custom indicator known as the ant-GUBreakout_V.0.4.1. You can download the .ex4 file here. This is the only custom indicator to be used. Other indicators are all default indicators found on the MetaTrader4 platform.
Strategy Implementation
To setup this strategy, load the custom indicator to the Experts Indicators folder of your MT4 client. Then open the platform. Once this has been done, select a currency pair which contains the USD to trade. It is suggested that the major pairs such as EUR/USD, GBP/USD, USD/JPY, USD/CAD and USD/CHF are used. The reason why the USD pairs are used is because of the time zone being used for the trade, which is a US time zone. You cannot expect traders in the New York time zone to be trading the Australian Dollar or New Zealand Dollar pairing with a currency like the Japanese Yen. The AUD, NZD and JPY are Asian time zone currencies so they should be left to traders from that zone.
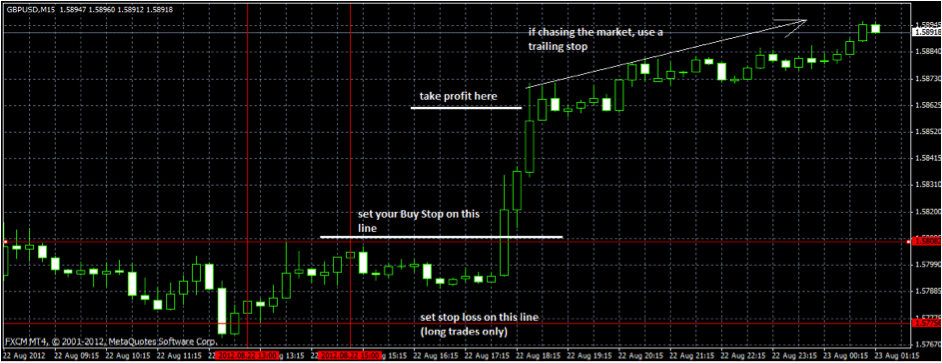
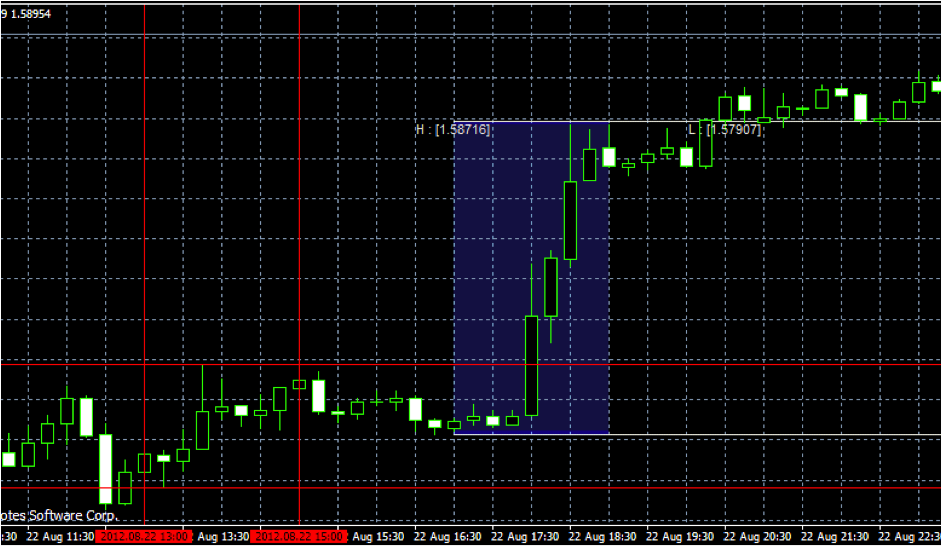
Next, open a 15 minute time frame chart for any of the pairs. We will use the GBPUSD as an example. Trace a vertical grid line to correspond to the candle at 1400 hrs UTC +1 (i.e. 1300hrs GMT candle), and also draw the same vertical grid line on the 1600hrs UTC+1 candle.
Once you have drawn the vertical grid lines, draw two horizontal lines with the trend line tool to the following points:
a) The highest candle point located between the vertical grid lines.
b) The lowest candle point located between the vertical grid lines.
Once you have done this, apply a Buy Stop 10 pips above the upper horizontal line and a Sell Stop 10 pips below the lower horizontal line. The trade should target a maximum of 40 to 50 pips. Once you are 40-45 pips to the good, apply your trailing stop if you intend to keep chasing prices, or allow the trade to trigger the Take Profit.
Now this looks very similar to the 15 minute breakout strategy, but with some modifications.
1) Only USD pairs are used for maximum effect.
2) The strategy can also be used as a modification of the news breakout strategy discussed earlier on this blog to catch many US news releases, which typically start at about 1430hrs UTC+1.
3) Signals are only valid for one trading day.
4) The custom indicator is designed to paint the charts and help the trader apply the same strategy to catch the London breakout and the Asian breakouts, simply by effecting some parameter changes in the indicator settings.
These modifiable settings are as follows:
a) Input: check how many hours your trading platform deviates from GMT and enter the number under “GMT shift of your broker”. To check the deviation, look at your local time, then go to Google search and use any of the World Clock sites there to see how the time difference of your location from GMT. Then point your mouse cursor to the current candle on your platform to show the candle opening time, and you can deduce the GMT shift.
b) To catch the other time zone breakouts, adjust the start time and end time from 1400hrs and 1600hrs to the respective breakout times. For instance, the London breakout occurs between 0600GMT and 0800GMT.
As a bonus, we have also added another indicator to help you mark the areas defined by the vertical grid lines and horizontal lines (the time areas). This indicator will help catch breakouts for the London and New York session. You can download this indicator by clicking here.


